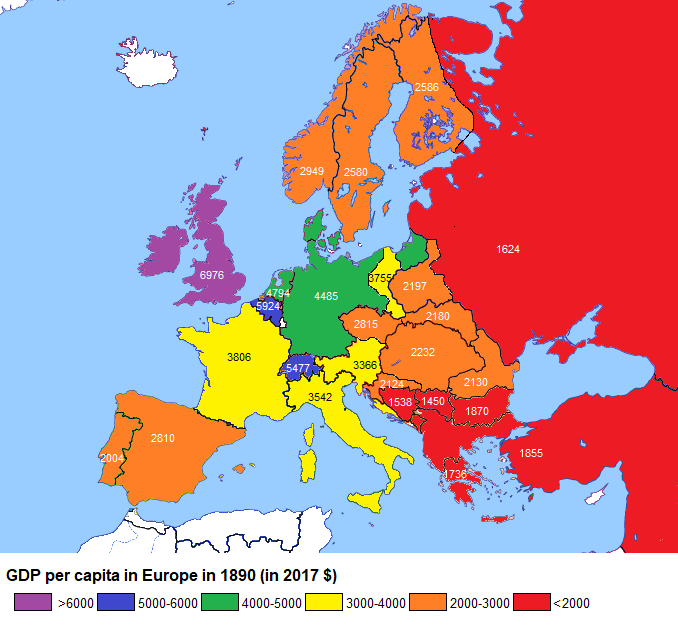
The map above shows the very approximate GDP per capita for various European states in 1890. Below we look at how these have changed over the past 127 years.
The table below lists most entities for which data are shown on the map. However, not all these entities were sovereign states in 1890 and the list includes some that were dependencies of other states at the time.
The table compares GDP (PPP) per capita in thousands of 2017 US dollars in 1890 and 2017. However, it should be noted that the boundaries of some states have shifted between the two dates, so that comparisons in such cases are approximate at best.
*In 1890 these were dependencies of other states.
**In 1890 these were parts of the Austro-Hungarian Empire.
The 1890 data are as shown on the map, as derived from Wikipedia, while the source for 2017 data is the IMF World Economic Outlook.
Caveats:
The numbers for 1890 are based on very rough estimates. While the map does give a general idea of the relative prosperity of different countries in 1890, the actual numbers should not be taken too literally.
Moreover, purchasing power parity is notoriously difficult to measure, while GDP itself is an imprecise measure of national prosperity. For example, it does not include the value of many non-market transactions.
For a discussion of the limitations of GDP see: The trouble with GDP
Observations:
All the countries listed have experienced significant growth in GDP (PPP) per capita since 1890, most by a factor of 10 or more. However, there is a wide variation in the amount of growth, ranging from around $10,000 to $68,000.
The largest such gains were experienced by Norway ($67.7K), Switzerland ($55.9K), Netherlands ($48.8K), Sweden ($48.7K), Germany ($45.7K) and Denmark ($45.4K).
Those gaining the least were Bosnia & Herzegovina ($9.9K), Serbia ($13.7K), Montenegro ($15.9K), Bulgaria ($19.7K), Romania ($21.9K) and Croatia ($22.0K).
One of the most striking changes between 1890 and the present is the decline in the relative position of the UK (which at that time included the whole of Ireland) and, to a lesser extent, Belgium.
Italy, France and Romania also lost some ground in the rankings.
In 1890 the UK was a leading industrial power, while Belgium was the first country on the European continent to industrialise.
Another significant change is the rise in the relative position of the Nordic countries (especially Norway, Sweden and Finland) since 1890.
These countries had been slower to industrialize, but advanced rapidly in the ensuing decades. Portugal and Russia also moved up noticeably in the rankings since 1890, although from a lower base.
If you’d like to learn more about this topic, have a look at the following books:
- An Economic History of Europe: Knowledge, Institutions and Growth, 600 to the Present
- The Cambridge Economic History of Modern Europe: Volume 2, 1870 to the Present
- A Short History of the British Industrial Revolution


